Every Local Currency, Accounted For
Real-time financial intelligence for your school.
The Challenge & Solution
Most school bursars manage finances through spreadsheets and guesswork — chasing parents for fees with no clear picture of what's been collected, what's still owed, or how spending compares to income. Femlify replaces that chaos with a single, always-accurate financial dashboard that forecasts income, tracks every payment, and surfaces trends before they become problems.
Finance at a Glance
Three views that give you instant clarity on your school's money
Financial Forecast
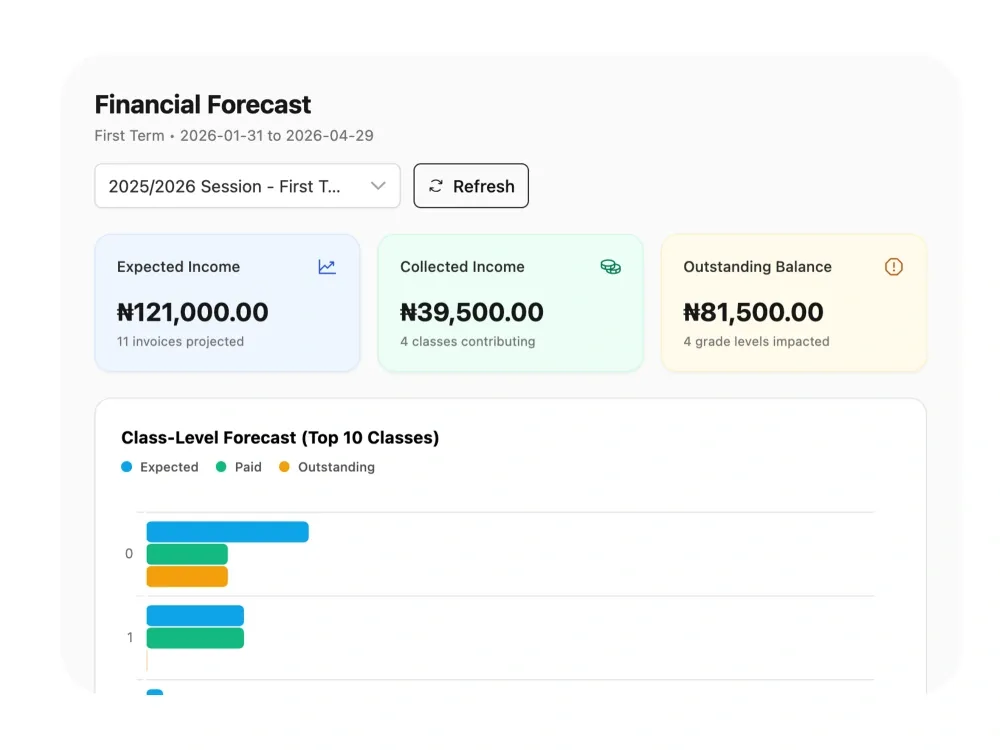
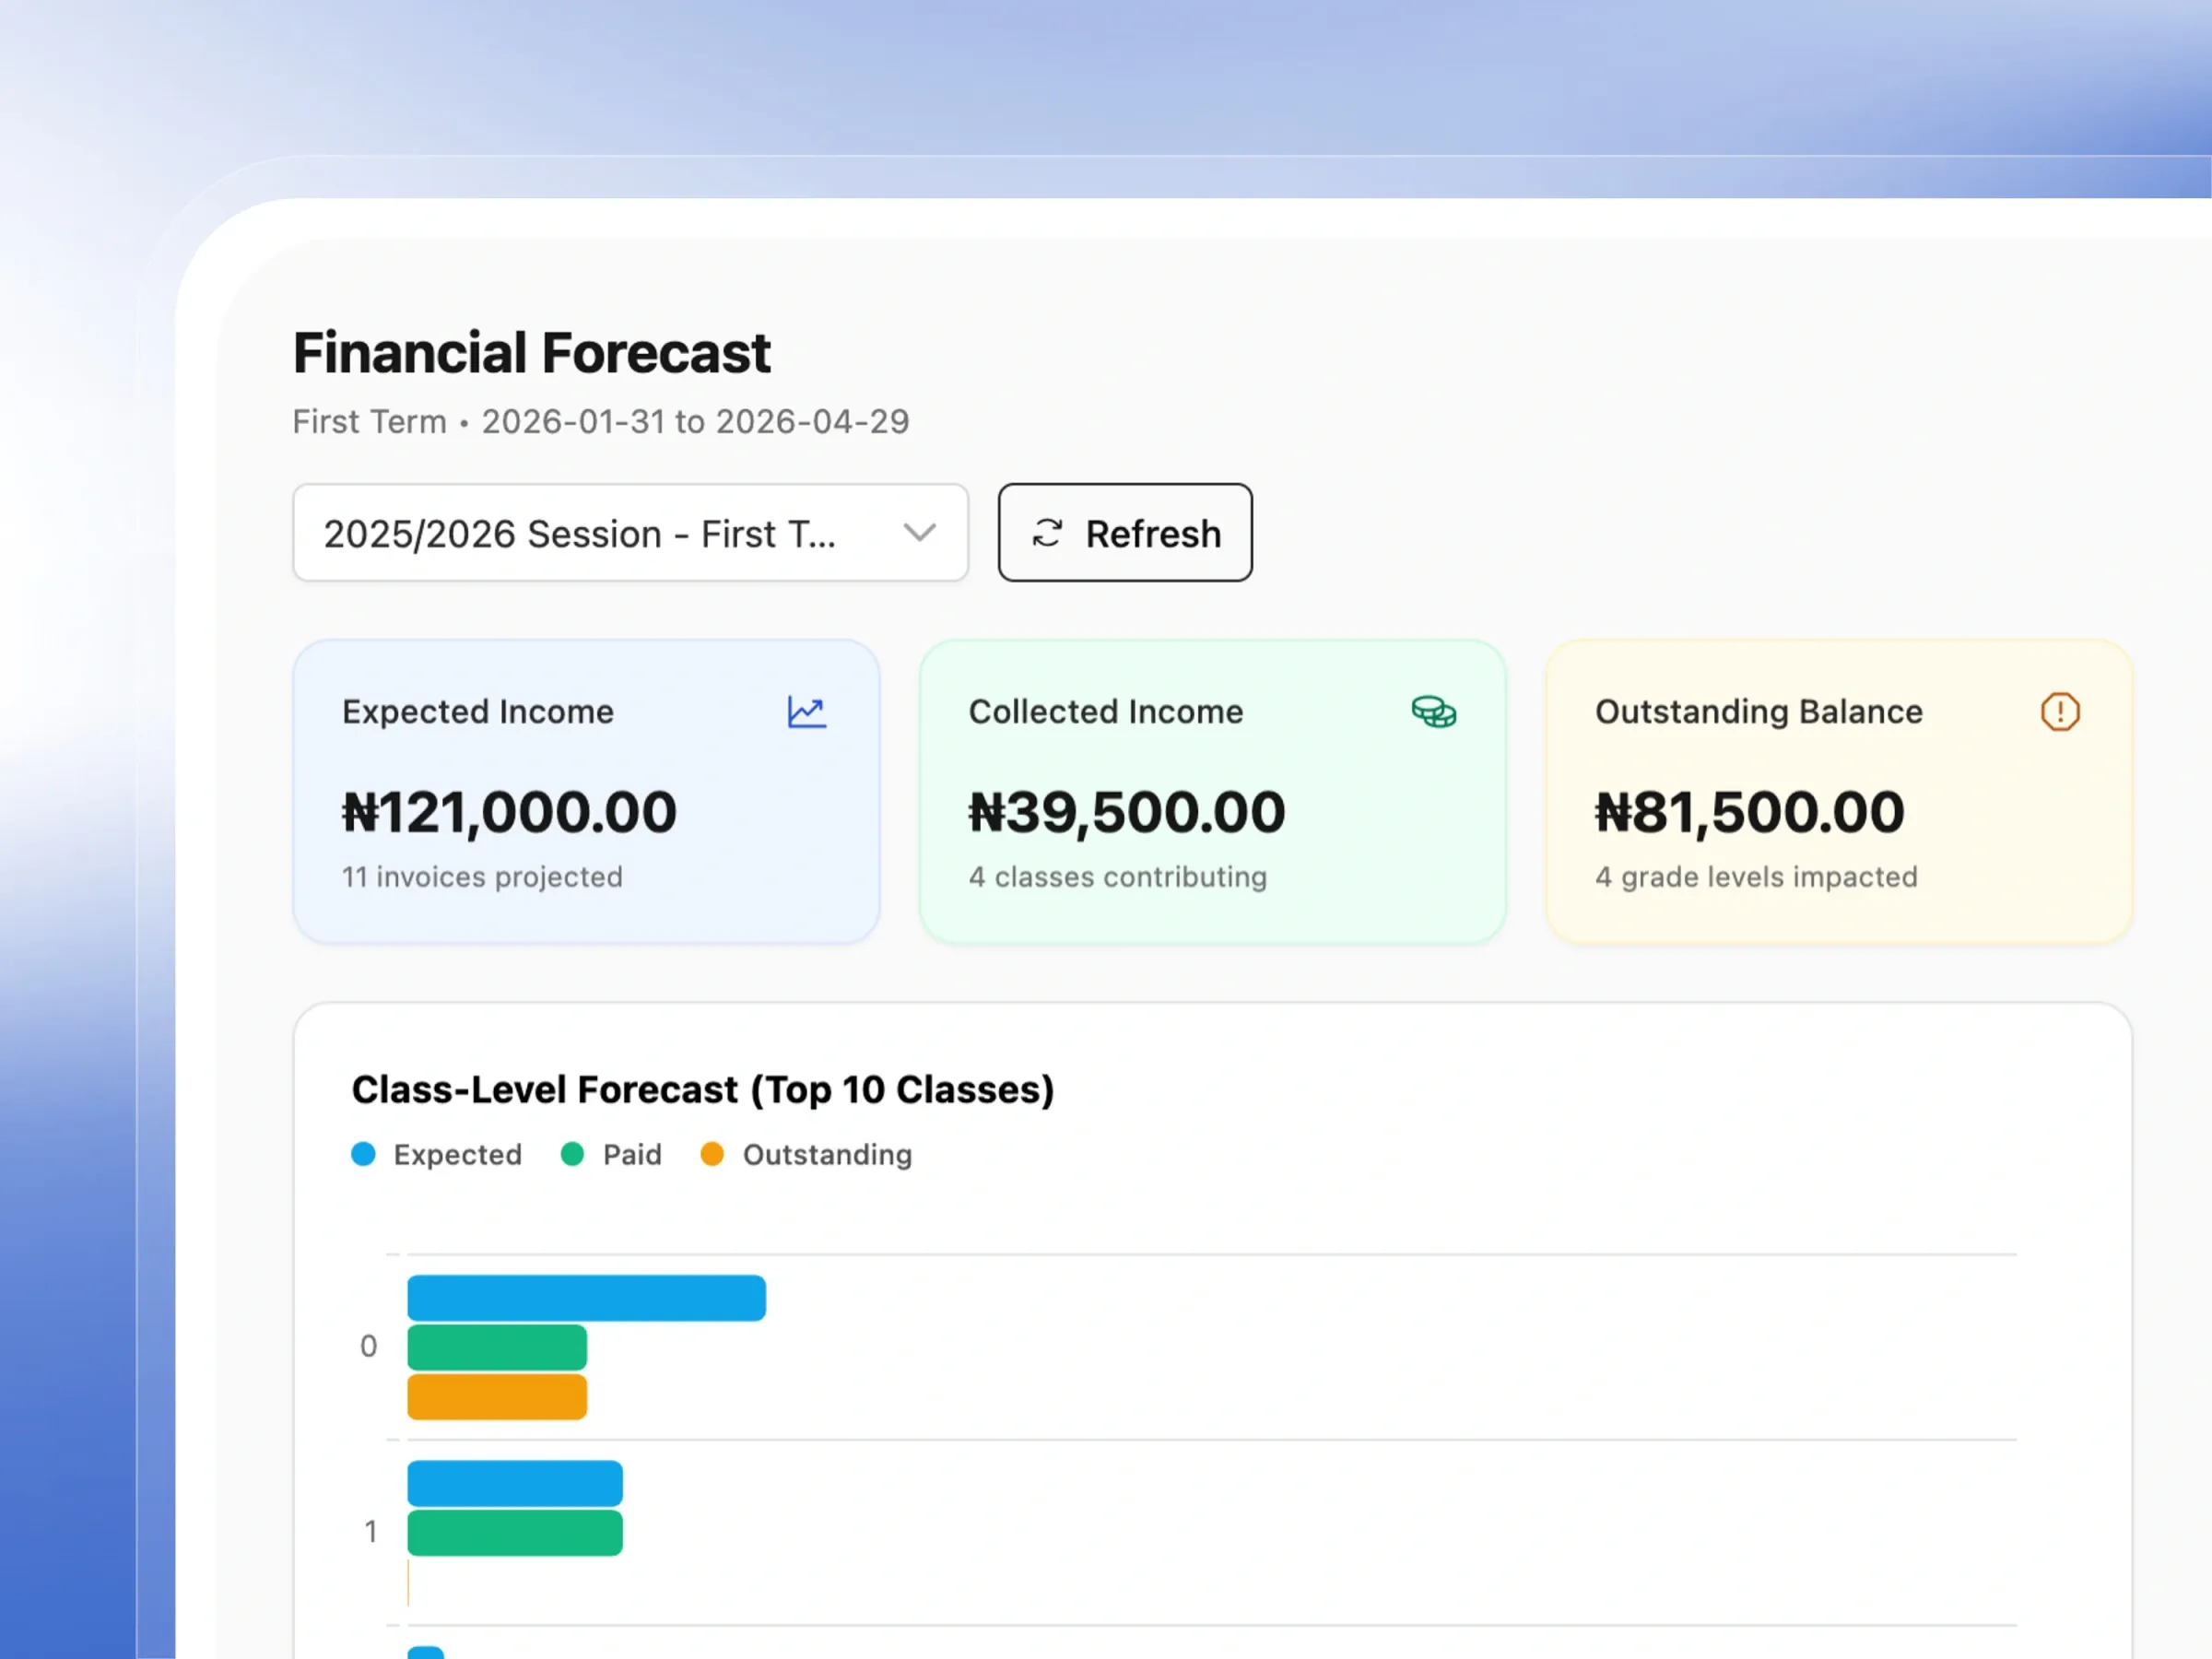
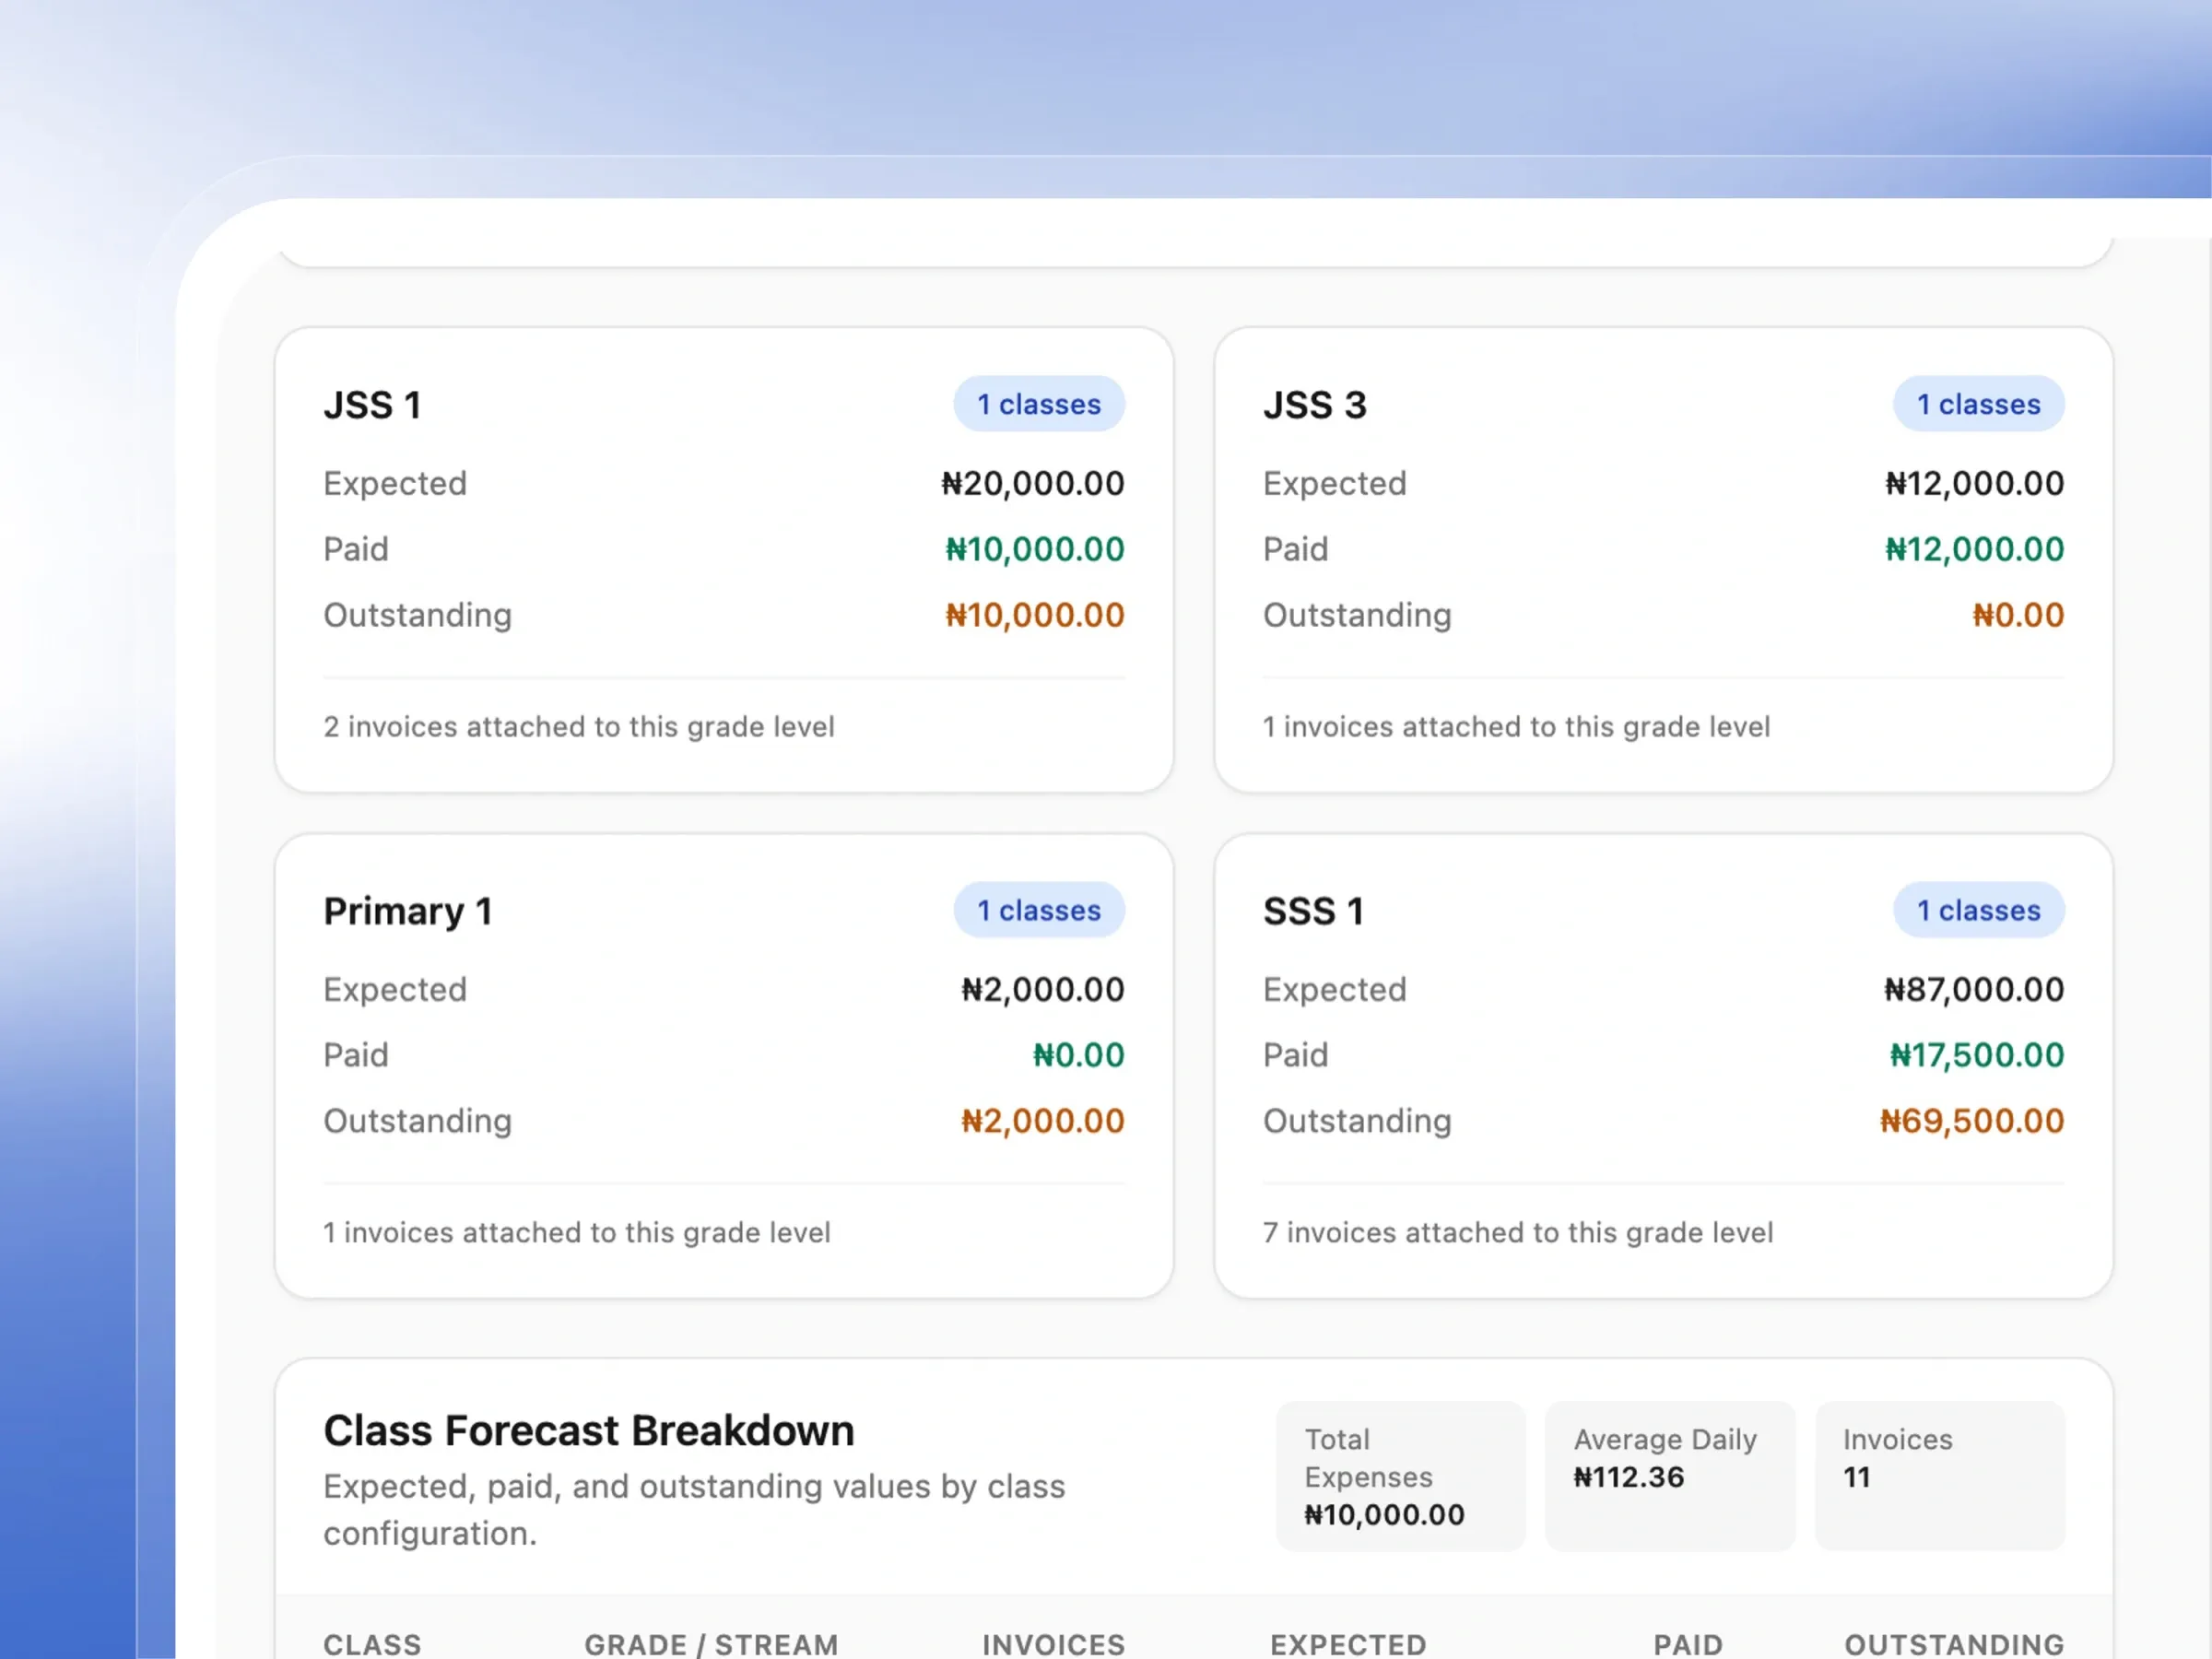
See your expected income, collected income, and outstanding balance for any term — broken down by class and grade level.
Financial Breakdown
Drill into invoice analytics and payment analytics side-by-side: total billed, total paid, overdue, disputed, completed ratio, and more.
Trend Analytics
Visualise invoicing, collections, expenses, and income-vs-expenses trends over any custom date range with interactive charts.
Built to give you total control over your school finances
From income tracking to detailed expense reports, see how our insights dashboard empowers your financial decisions.
Financial Forecast
See where your finances are headed
Look ahead and plan with confidence. See exactly what your school expects to earn, what has been collected, and what is outstanding.
- View expected income and outstanding balances at a glance.
- See a visual breakdown of payments across your top classes.
- Track your projected expenses for the current academic term.
- Easily switch between different terms to compare your forecasts.
Financial Breakdown
Understand exactly where the money goes
Dive deep into your school's financial data without the headache. Easy-to-read charts highlight your invoicing and payment trends.
- Review the exact status of all invoices, from paid to pending.
- See a clear summary of total billed amounts versus collected cash.
- Visualize your collection trends over any custom date range.
- Compare your overall income against expenses in a simple chart.
Gain Crystal Clear Financial Visibility
Make confident decisions with real-time analytics, expected income tracking, and trend forecasting
Expected vs Collected Income
Gain instant clarity on your school's financial health by easily comparing expected income to actual collections.
Invoice Status Breakdown
Never lose track of an invoice again with a unified dashboard showing the exact status of every bill.
Payment Completion Ratio
Quickly gauge the effectiveness of your fee collection strategy using beautifully visualized payment metrics.
Grade-Level Financial Cards
Identify exactly which grade levels are performing best with clear, detailed financial breakdowns.
Term & Session Filtering
Make smarter long-term financial decisions by effortlessly comparing your revenue across different academic terms.
Multi-Chart Trend Views
Visualize your school's entire financial trajectory with gorgeous, interactive trend charts.
Expenditure Tracking
Keep your budget firmly under control by closely tracking your actual expenses against projected outflows.
Live Refresh
Make real-time financial decisions with instantaneous, live data updates right at your fingertips.
Built for Real School Finance Scenarios
Term-End Fee Audit
Secondary SchoolAt the end of term, the bursar opens the Financial Breakdown page, filters by the current session and term, and instantly sees 392 invoices published with ₦20.4M billed. Outstanding balance and payment status are visible without opening a single spreadsheet.
Grade-Level Revenue Planning
K–12 SchoolThe principal wants to know which grade levels contribute the most revenue. The Financial Forecast page shows class-level bar charts and individual grade cards — Junior High 1 projects ₦2.28M, KG levels show their own figures — making budget planning straightforward.
Monthly Cash Flow Review
Private SchoolThe school owner reviews the Invoicing Trend and Collections Trend charts filtered to the past two months to spot when fee collection dipped and align it with reminder campaigns — no manual data compilation required.
Who Benefits Most
Bursars & Accountants
Replace manual reconciliation with a live dashboard that shows every invoice, payment, and outstanding balance in one place.
School Proprietors
Monitor the financial health of your school across terms and sessions without waiting for monthly reports.
School Administrators
Use grade-level financial breakdowns to make informed decisions on fee structures and collection policies.
Multi-Level Schools
Schools running nursery, primary, and secondary arms get consolidated and per-grade visibility in a single dashboard.
Why Femlify Financial Insights Is Different
Most school systems show you a list of payments. Femlify shows you the full financial story — forecast vs reality, invoice health, payment completion rates, and spending trends — all filterable by term, session, or date range, and always in sync with your live data.
Forecast Before You Collect
See projected income from invoices before a single payment arrives, so you can plan ahead.
Two Levels of Analysis
Forecast view for planning, Breakdown view for auditing — two focused dashboards, not one cluttered screen.
Four Trend Charts
Invoicing, Collections, Expenses, and Income vs Expenses trends give you a time-series view no spreadsheet can replicate.
Always Up to Date
Figures refresh on demand — no waiting for end-of-day reports or manual data imports.
Financial Insights Connects Well With These Features
Financial Insights connects directly into the rest of Femlify
Fee & Payment Collection
Generate invoices, accept payments online, and manage fee structures across all classes and terms.
Assessment & Reports
Track academic performance alongside financial data for a complete picture of your school.
School Customization & Setup
Configure sessions, terms, grade levels, and fee structures that power your financial data.
Frequently Asked Questions
Stop Guessing. Start Knowing.
Get complete financial visibility for your school in minutes.